

Displacing Corn and Soybean Meal in Livestock Feed Rations
AgMRC Renewable Energy Newsletter
May 2010
Daniel M. O’Brien, Extension Agricultural Economist
Kansas State University
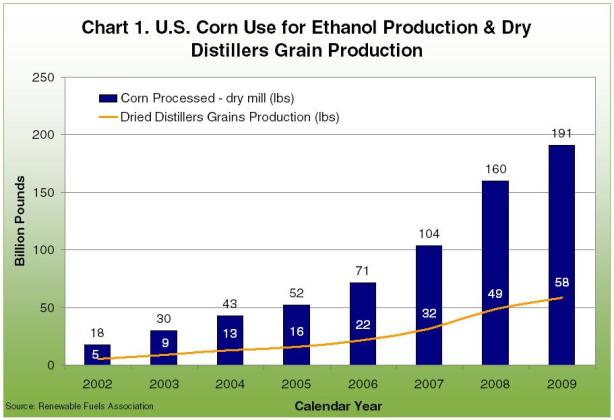
As feedgrain-based ethanol production in the United States has expanded in recent years in accordance with the U.S. Renewable Fuels Standard, the production of distillers grains has increased proportionally. The amount of corn processed in dry mills for ethanol production in the U.S. increased from 17.6 to 190.8 billion pounds (314.82 to 3,407.85 million bushels) per year over the 2002 – 2009 period (Chart 1). At the same time annual production of distillers grains increased from 5.3 to 58.3 billion pounds annually (Source: Renewable Fuels Association).
Feed Ration Inclusion Rates
Increasingly available supplies of distillers grains are being used in livestock feed rations, both domestically and overseas. University studies have examined both the effectiveness and limitations of using distillers grains in livestock feed rations as a substitute for corn, soybean meal and other feed ingredients. Bremer, et al., (2010), Shurson (2009) and others have examined the use of distillers grains in beef cattle, dairy, swine and poultry rations. It is estimated that of the distillers grains used domestically in the U.S. in year 2009, 39% was used in dairy rations, 38% in beef cattle rations, 15% in swine production, 7% by poultry, and 1% by other livestock species (source: Renewable Fuels Association).
Conservative recommendations for inclusion of distillers grains in feed rations vary by livestock species. For beef cattle, recommended inclusion rates for dried (10% moisture) and wet (65% moisture) distillers grains co-products are 20% and 40%, respectively. In dairy cattle rations, inclusion rates of dried and wet distillers grains co-products of 10-15% have commonly been recommended. In swine feed rations, inclusion rates of 10% or more have been recommended. Inclusion rates of 10% have also been recommended for poultry feed rations.
Displacement Rates for Competitive Feedstuffs
Based on these and other results of livestock feeding research and actual use, procedures such as those developed by Argonne National Laboratory (Arora, Wu and Wang, 2008) have then been used to calculate the degree to which distillers grains can be used to substitute for or to “displace” corn and soybean meal in livestock feeding rations. From the 2008 Argonne study, it is estimated that for beef cattle feed rations, 1 pound of distillers grains can substitute for approximately 1.25 pounds of corn. In dairy rations, 1 pound of distillers grains can substitute for 0.51 pounds of corn and 0.58 pounds of soybean meal. In swine rations, it is estimated that 1 pound of distillers grains can substitute for 0.95 pounds of corn and 0.095 pounds of soybean meal. These estimated distillers grains displacement rates are constrained by the recommended feed ration inclusion rates discussed above.
Competitive Feed Price Relationships
Livestock producers are most typically behaving according to the principles of profit maximization in selecting feed ration inputs. As such, they will use feed inputs in a manner that will provide them with the most net revenue over feed costs. For an individual feedstuff such as distillers grains, a livestock feeder will use additional amounts of distillers grains up to the point where the value of additional income gained from either live animals or milk products produced equals the cost of the additional amount of distillers grains used in the feed ration. Livestock feeders are balancing the use of alternative feedstuffs such as corn, grain sorghum, soybean meal, etc. with distillers grains with the goal of maximizing the profitability of their livestock feeding enterprises.
With this goal in mind, it is important to understand how the prices of corn, soybean meal and distillers grains have changed over time in relation to each other. All else being equal (“ceteris paribus” as economists commonly assume), if the cost of a particular feed input trends higher than its competitive substitutes, it is likely that less of that feed input will be fed in a profit maximizing livestock feed ration. Conversely, if the cost of a feed input is trending lower on a relative basis versus its competitive substitutes, it is likely to be used to an even greater degree in feed rations than before. When comparing the cost of competitive feed inputs, a uniform cost measure such as prices on a “per pound” basis provide an equivalent base of comparison for determining which feed inputs to use.
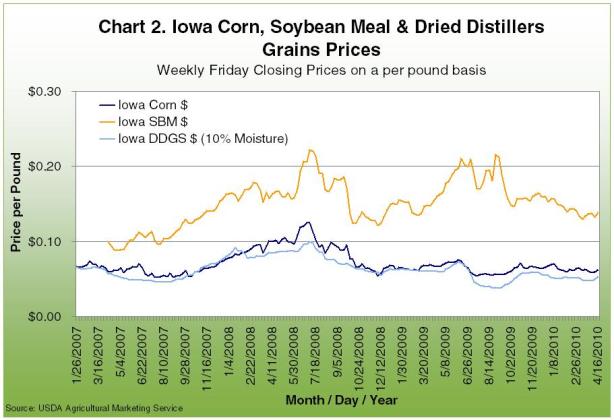
Iowa Corn, Soybean Meal & Dried Distillers Grain Prices
Average Friday closing cash market prices in Iowa for corn, soybean meal and dried distillers grains (10% moisture) since January 2007 are shown on a per pound basis in Chart 2. On a per pound basis, prices for corn and dried distillers grains with solubles (DDGS) have been nearly equal for much of this time period, but with DDGS being at least moderately lower priced since July 2009. Soybean meal prices per pound have been markedly higher than either corn or distillers grain prices over the 2007 – early 2010 time period.
Percentage-wise, Iowa DDGS prices per pound have been generally trending lower relative to both corn and soybean meal (SBM) prices over the 2007-early 2010 period (Chart 3). On a per pound basis, Iowa prices of DDGS have trended from 50-60% of corn prices in early-to-mid 2007 down to 17-18% in early September 2009, before recovering to consistently be in the 31-36% level since October 2009. Relative to soybean meal prices, Iowa DDGS prices have been as low as 67% of SBM (early September 2009), with current DDGS prices being approximately 38% of SBM prices on a per pound basis.

Nebraska Corn & Wet Distillers Grain Prices
Average Friday closing cash market prices in Nebraska for corn and wet distillers grains (65% moisture) since January 2007 are shown in Chart 4. For comparison sake, Iowa SBM prices are also included. On a per pound of product basis, wet distillers grain (WDGS) prices have been markedly lower than both corn and especially SBM for this time period.

Percentage-wise, Nebraska WDGS prices per pound have been generally trending lower relative to both corn and soybean meal (SBM) prices over the 2007-early 2010 period (Chart 5). On a per pound basis, Nebraska prices of WDGS have trended from a high of 26% of corn prices in early April 2007 down to 7-8% in early September 2009, before recovering to consistently be in the 12-14% range since October 2009. Relative to soybean meal prices, Nebraska WDGS prices have been as low as 27% of soybean meal (during both June 2008 and October 2009), with current WDGS prices being approximately 29% of SBM prices.

The relative values of dried distillers grains (10% moisture), moderatively wet distillers grains (50-55% moisture, and wet distillers grains (65% moisture) in Nebraska are shown in Chart 6.

Percentage-wise, the prices of MDGS and WDGS have been relatively consistent in comparison to DDGS over the 2007-2010 period, likely reflecting the relative feed value of these alternative distillers grains products (Chart 7). Since early 2007, MDGS prices have averaged 48.5% of DDGS prices in Nebraska, while WDGS prices have averaged 36.4% of DDGS prices over the same time period.

Conclusion
These results indicate that on a per pound basis, distillers grains prices have declined relative to corn in both Iowa and Nebraska since early 2007. In comparison to soybean meal, distillers grains prices are now near their low for the period in question. Current prices of dry, medium wet and wet distillers grains products in Nebraska are near their average relative price level relationships for the 2007-early 2010 period.
The current situation of relatively low priced distillers grains versus corn and soybean meal in Iowa, Nebraska and other parts of the United States is continuing to provide an incentive to livestock feeders to include these products in their feed rations - up at profit maximizing inclusion levels.
