

Ethanol, Gasoline, Crude Oil and Corn Prices: Are the Relationships Changing?
AgMRC Renewable Energy & Climate Change Newsletter
March/April 2014
 Dr. Robert Wisner
University Professor Emeritus
Iowa State University
and Biofuels Economist
rwwisner@iastate.edu
For a number of recent years, a close relationship has existed between corn, ethanol, and gasoline prices. The relationship was driven by government mandates requiring increased use of ethanol in gasoline as well as the time required for the ethanol industry to increase capacity to meet the mandated volumes. The domestic ethanol market now is near or at a saturation point that could be temporary or long-term, depending on future government mandate policies. U.S. and world corn supplies have recovered to a record level after the major 2012 U.S. drought that sharply reduced production and tightened available ethanol feedstock supplies. Corn supplies, barring another period of adverse weather, appear ample for both feed and fuel needs for the next few years if the corn-starch ethanol industry capacity remains near the current level. This article examines the question of whether ample corn supplies and domestic ethanol market saturation have changed the price relationships among these commodities.
Corn-Crude-Oil Price Relationships
As corn evolved into a major motor-fuel energy source, a close relationship between corn (the major feedstock for ethanol) production, and crude oil, the main feedstock for gasoline production, was expected. Figure 1 shows a close relationship between changes in corn prices and changes in crude oil prices from late 2004 through mid-2008, when rapid expansion of the ethanol industry was occurring. Comparisons in Figure 1 are on a dollar per pound basis. A gallon of crude oil weighs approximately seven pounds, while a bushel of corn weighs 56 pounds. There are 42 gallons in a barrel.

In mid-2008, with the severe decline in the economy, crude oil prices dropped sharply. Corn prices declined during that period, but not as sharply as the crude oil price. As crude oil prices recovered from late 2009 through late 2011, corn prices also increased, but at a faster rate than crude oil as corn supplies tightened in response to rapid increases in government ethanol blending mandates and rapid growth in the demand for corn to produce ethanol and distillers grain. From the spring of 2012 through mid-2013, corn prices moved far above their historical relationship to crude oil. The surge in corn prices was driven by severe drought across the U.S. Corn Belt and very tight U.S. and world corn supplies. In the last half of 2013, corn prices fell sharply in response to improved U.S. corn growing conditions, a record U.S. corn crop, and increased foreign grain production that resulted from favorable weather and the very strong price incentive to increase production. Corn prices in early 2014 began to stabilize near their 2004-05 relationship to crude oil. At that time, the corn industry had surplus supplies and corn prices were about one-fourth the price of crude oil on a per pound basis. From this chart, it can be concluded that a number of developments can cause substantial volatility in the relationship between crude oil prices and corn prices, and that the crude oil cannot be used as a precise predictor of corn prices.
Since ethanol is an alternative to gasoline as a motor fuel, Figure 2 looks at the relationship between crude oil prices and gasoline prices to see how stable that relationship has been. During the period from January 2003 to August-2006, there was a close relationship between these two sets of prices. In that period, an average of 19.75 gallons of gasoline equaled the price of a barrel of crude oil, although there was variability around the average. In the latter part of the period shown in Figure 2, around 30 gallons were required to match the cost of crude oil. Less than half of a barrel of oil is made into gasoline so the relationship of gasoline to crude oil prices can be affected by other petroleum products. A total of about 45 gallons of products are obtained from a 42 gallon barrel of crude oil. As the value of the other products changes, the value needing to be recovered from gasoline changes.
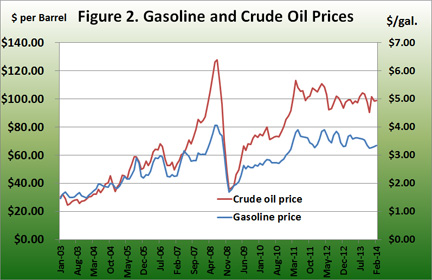

U.S. Energy Information Administration (EIA) data indicate one barrel of crude oil produces approximately 19 gallons of gasoline, as shown (1). The changing relationship between crude oil and gasoline prices reflected several developments, one of which could possibly have been an increasing value of diesel fuel as the refining industry was required to move to ultra-low-sulfur diesel fuel. On average, about 10 gallons of diesel fuel are produced from a barrel of crude oil, although the amount varies seasonally and in response to other conditions. (2)
Figure 3 shows the relationship between diesel fuel prices and crude oil prices. The relationship looks very similar to the relationship between gasoline and crude oil prices. Consequently, the changing relationship of gasoline prices to crude oil appears to be due to some other factor such as increased value of other products produced from a barrel of crude oil.

Relationship of Jet Fuel and Crude Oil Prices
In an attempt to explain why gasoline and diesel fuel have lagged substantially behind increases in crude oil prices, the relationship between jet fuel and crude oil prices is shown in Figure 4, to see if an increasing portion of the value of crude oil has come from that source in recent years. Increases in jet fuel prices have more closely followed increases in crude oil prices than gasoline or diesel fuel. Even so, increases in jet fuel prices since 2009 have lagged behind increases in crude oil prices.

Possible Causes of Fuel Prices Lagging Behind Crude Oil Prices
Possible causes of motor fuel and aviation fuel prices lagging behind crude oil prices might include (1) rising prices for chemicals and other non-fuel products made from petroleum, (2) possible increased competition in the refining industry as a result of biofuels and the resulting decline in the petroleum industry’s motor fuel market share, and (3) possible increases in efficiency of the petroleum refining industry.
Relationship of Ethanol and Gasoline Prices
Figure 5 shows the relationship between retail gasoline prices and ethanol prices at plants in Iowa since January 2005. From mid-2005 through mid-2007, a relatively close relationship existed between ethanol and gasoline prices. Ethanol production capacity was limited and the industry was expanding rapidly during that period. The expansion was driven by strong ethanol prices that reflected the blenders’ tax credit, the need for oxygenated fuel additives, and government blending mandates. These factors kept at-plant ethanol prices in the heart of the production area near those of retail gasoline prices. By late 2007, there was a need to increase sales of ethanol in retail markets that are long distances from the major production areas in the Midwest. Expansion in these more distant regions was necessary to develop a market for the expanded ethanol production capacity and the increasing government ethanol blending mandates.
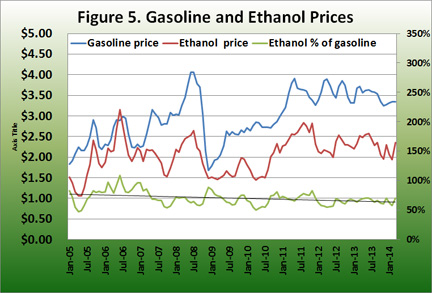
Since ethanol must be transported by rail or truck in contrast to pipeline transport of gasoline, its transport costs are relatively high. The transport costs were a factor behind the widening spread between gasoline and ethanol along with saturation of the oxygenated fuel market needs. Also, as supplies increased, ethanol prices tended to more fully reflect ethanol’s lower energy content than gasoline. The energy content of ethanol is about 2/3 that of gasoline, although part of the value difference is offset by ethanol’s higher octane content and the ability of refiners to produce cheaper low-octane gasoline and upgrade the octane level with ethanol. In early 2006, ethanol prices were about 80% of the price of gasoline. By early 2014, with the domestic ethanol market nearly saturated, ethanol prices at Iowa plants were about 58% of retail gasoline prices.
In late March, wholesale ethanol prices moved above wholesale gasoline prices, a change that most analysts believe will be temporary. The causes for recent increase in ethanol prices in markets outside the Corn Belt include serious rail transportation impediments brought on by the severe winter and strong demand for rail equipment to ship crude petroleum from newly emerging production areas. Transport problems and the severe winter weather that reduced production slightly have kept U.S. wholesale ethanol stocks at or near historically low levels, a situation that is expected to be temporary.
Whether ethanol prices will weaken relative to gasoline in the next few years will depend heavily on whether the domestic market can be expanded beyond the current blend-wall saturation level.
Relationship of Corn and Ethanol Prices
Figure 6 shows the relationship between corn and ethanol prices. Ethanol and distillers grain and solubles (DGS) have become the second-largest source of demand for U.S. corn. In the current marketing year, this demand is projected to use 36% of last year’s U.S. corn crop. (3) Because of this, corn prices have moved in a close relationship with ethanol prices since mid-2007, except for 2012 and the first two-thirds of 2013 when corn prices were driven by very tight drought-reduced supplies. Before mid-2007, corn faced a chronic surplus supply-demand situation except in years of major weather problems. With the rapid expansion of ethanol production capacity, corn, from mid-2007 through 2013, became the limiting factor in the ethanol supply chain. That caused corn prices to be bid up until they reached the breakeven level for ethanol producers and the capacity expansion stopped.

The Future
Whether the corn-ethanol price relationship will be as close in the future as in the recent past will depend partly on whether the blend wall can be raised and domestic ethanol demand expanded substantially in the years ahead. The blend wall has occurred because a 10%ethanol–90% gasoline blend has become the excepted maximum feasible blend for all models and years of gasoline-powered vehicles.
Ethanol demand in the years ahead will remain an influence on corn prices but its impact is likely to be less than in the recent past unless the blend wall can be removed or modified. If ethanol demand does not expand in the future, rising corn yields will likely shift corn back to a chronic surplus supply with relatively low prices, except in years of adverse weather. Instead of ethanol driving corn prices, the reverse may be true with ethanol prices being heavily influenced by corn’s impact on ethanol production costs. Corn is by far the largest cost component of corn-starch ethanol production costs.
The Chinese economy and other global feed demand developments will continue to be important influences on corn prices, but their impact may be less than when ethanol was a rapidly expanding industry. One other development will likely be an influence on ethanol and corn prices. That is the emergence of cellulosic ethanol production and increasing mandates to use this and other advanced biofuels. At least two cellulosic ethanol plants are expected to begin operation in the near future. Their production will tend to displace ethanol made from corn starch because of aggressive increases in advanced biofuels in the next few years. That will further complicate a domestic ethanol market that is nearly saturated.
Expanding the Domestic Ethanol Market
As a possible way of expanding the domestic market for ethanol, the U.S. Environmental Protection Administration has approved fuel blends containing 15% ethanol and 85% ethanol (E15) for use in vehicles from the 2001 model year to date. Acceptance of E15 in the motor fuel industry has been very slow. Retail fuel marketers offer a number of reasons for their reluctance to market this fuel, but over time its use may increase. E85 is another alternative. It can be used only in flex-fuel vehicles and its market has been limited by (1) the small number of retail fuel stations selling it, (2) a limited but increasing percentage of the vehicle fleet that is made up of flex-fuel vehicles, and (3) lack of competitiveness of E85 with gasoline and E10 because of its much lower fuel mileage per gallon. With favorable U.S. and foreign weather, relatively low corn prices may continue in the next few years, thus reducing the cost of ethanol production and making E85 more competitive in the market place.
Declining Gasoline Use
One other major concern of the motor fuel industry – including ethanol producers -- is the downward trend in the nation’s gasoline use in the last several years. Federal automobile fuel mileage standards announced in August 2012 will increase the industry average on new passenger cars to 55.3 miles per gallon by 2025, an increase from 35.2 miles per gallon in 2014. (4) With that goal, U.S. gasoline use appears likely to continue its longer-term downward trend. However, increased foreign use and competitive U.S ethanol prices from lower-cost corn could lead to expanded export demand for ethanol.
Sources
1 EIA, ”Oil: Crude and petroleum products explained, refining crude oil”
2 Ibid.
3 World Agricultural Outlook Board, USDA, World Agricultural Supply-Demand Report, March 10, 2014
4 Center for Climate and Energy Solutions, “Federal Vehicle Standards”
