

An Overview of U.S. Progress in Renewable Energy
AgMRC Renewable Energy Monthly Report
May 2015
 Dr. Robert Wisner, University Professor Emeritus
and Biofuels Economist, Ag Marketing Resource Center
rwwisner@iastate.edu
U.S. government policies and programs have encouraged the development of a broad range of renewable energy sources for the last several years in an effort to reduce greenhouse gas emissions and move closer to energy independence. These programs have affected several major sectors of the nation’s economy. In this report, we review the progress that has been made, some challenges, and also provide a perspective on estimated progress in reducing greenhouse gasses. Renewable motor fuels progress is widely known and has affected most of the U.S. population by providing alternatives to petroleum-based motor fuels. Research also indicates motorists have benefited from lower gasoline prices as a result of the large expansion in biofuels production. However, a number of other sources of renewable energy have developed that may not have received as much publicity as biofuels. In this article, we review trends in various sources of U.S. renewable energy.
Over-view of U.S. total energy use
The chart below shows a picture of total U.S. energy use in 2011, the latest data available in this form from the U.S. Department of Energy. To provide a common denominator for various types of energy, units are in quadrillion BTU. Petroleum has been the largest source of U.S. energy consumption and is used for motor fuel, aviation fuels, home heating, plastics, industrial chemicals production, and other products. In 2011, it accounted for slightly more than one-third of all energy used in the U.S.
Natural gas is the second-largest U.S. energy source, accounting for one-fourth of the nation’s energy needs. Its use has expanded substantially in the last several years with increased domestic production. Natural gas improves air quality when compared with coal and petroleum-based fuels. Even so, it is carbon-based and is from non-renewable sources and thus is a source of greenhouse gasses. For that reason, there is incentive to develop economical and renewable sources to replace a portion of the nation’s natural gas utilization.
Coal is the third-largest U.S. source of energy, accounting for one-fifth of our national energy requirements. It continues to be the dominant source of energy for electric power generation, but is increasingly being supplemented by natural gas and to a small extent by renewable sources. Nuclear power use for electricity is a relatively small but is a significant source of energy.

Renewable forms of energy accounted for nine percent of total U.S. energy consumption in 2011. The share of energy from this source likely has increased at least slightly since 2011. Renewable energy, as shown in the chart, includes seven major categories. Slightly over one-third of the renewable energy is from hydropower. Wood accounts for nearly one-fourth of total U.S. renewable energy use and includes its use for home heating as well as burning wood pellets in electrical generating plants. Biofuels account for another 21% of U.S. renewable energy production. Wind energy contributes another 13% to the nation’s energy use, along with eight percent from biomass waste, geothermal, and solar energy.
Electric power generation
The traditional method of generating electric power has been with the use of coal as the major energy source. Major improvements have been made in reducing emissions from coal-fired plants, but sulfur, greenhouse gas, and other emissions adversely affecting air quality continue to be a concern in the generation of electricity from coal. To address these concerns, 29 states and Washington, D.C. have established renewable standards for electric power generation (1). These standards require electric utilities to gradually increase the percentage of electric power generated with renewable sources. State standards range from a low of 2% to highs of 40% in Maine and Hawaii and 50% in Alaska. Target dates for reaching these levels vary by state but in many cases are 2020 to 2025. Minnesota has the highest standard in the Midwest, at 27.5% of its electricity by 2025. Most southeastern states as well as Nebraska, Wyoming, and Idaho had not adopted these standards in early 2013 (2).
The top states in total electricity generation from wind energy are California and Iowa. California moved above Iowa for the No. 1 ranking in 2012 total wind-generated electrical production, but with an aggressive construction currently underway, Iowa is expected to soon regain its top ranking among states in total wind energy electrical generation. In 2014, it ranked No. 1 in percentage of the state’s total electric power needs at 29%. California produced more electricity from renewable sources than Iowa, but with larger total electricity consumption, its percentage of total production coming from renewable sources was only 6.7%. A vice president of Berkshire Hathaway, owner of MidAmerican Energy Company which in turn owns a major part of the Iowa wind energy facilities indicates Iowa will have capacity to produce half of its electricity needs with wind energy by 2016 when a $1.9 billion construction project is completed (3).
Rankings of other top states in percentages of their electricity coming from wind included South Dakota at 25%, Kansas at 22%, North Dakota at 18%, Oklahoma at 17%, and Minnesota at 16%. Wind energy projects exist or are being developed in all 50 states (4).
Trends in renewable energy production
Figure 2 below shows the trend in U.S. renewable energy consumption by sources from the mid-1950s through 2011. Hydroelectric power generation is the largest U.S. source of renewable energy. Major growth in this sector occurred in the 1940s through 1970. Since that time, the trend in electrical production from hydroelectric sources has been nearly flat, but with year-to-year fluctuations. Use of energy from wood accelerated rapidly in the mid-to-late 1970s, reaching a peak in 1983 and trending downward since that time. New technological developments in wood pellet production and use in electric power plants may help to stabilize or possibly increase the amount of energy generated from wood. Depending on progress in converting cellulose to ethanol and other biofuels, some waste forest products may be converted to motor fuel in the years ahead.
The largest growth areas in U.S. renewable energy to date have been biofuels and wind energy. Future growth in biofuels will be influenced by government mandates, possible renewal of tax credits for biodiesel, trends in car and light truck fuel mileage mandates, and whether E-15 gasoline-ethanol blends will be made widely available to motorists. As this is being written, the Environmental Protection Agency’s proposed mandates for 2015 and 2016 have not yet been released. Court action required that they be released by June I of this year. The major constraint to increased U.S. domestic biofuel consumption is that because of the E-10 national “blend wall,” the market is saturated. Future growth or reduction in use will depend on the trend in gasoline consumption. For the last half dozen years until 2014, the trend has been downward. Recent lower gasoline prices have temporarily reversed that trend. However, U.S. government fuel mileage standards call for a large increase in fleet average fuel mileage for cars and light trucks in the next several years. With those requirements, total domestic use of gasoline and ethanol blends is likely to be in a longer-term downward trend despite the modest increase in the last several months.

With on-going projects and state goals to increase the use of wind energy for electricity, renewable energy from wind almost certainly has continued to increase from 2011 to 2015 and likely will continue to expand for the next several years. Tax incentives have been an important factor encouraging expanded wind energy electrical generation and may continue to influence its longer-term trend if they are renewed. As indicated in a recent article by Don Hofstrand, solar energy use for electric power generation is expanding rapidly and is likely to continue to expand in the future. Hofstrand notes that solar energy provided a larger increase in U.S. electrical generating capacity in 2013 than wind energy. It was the second-largest source of new electrical generating capacity after natural gas (5).
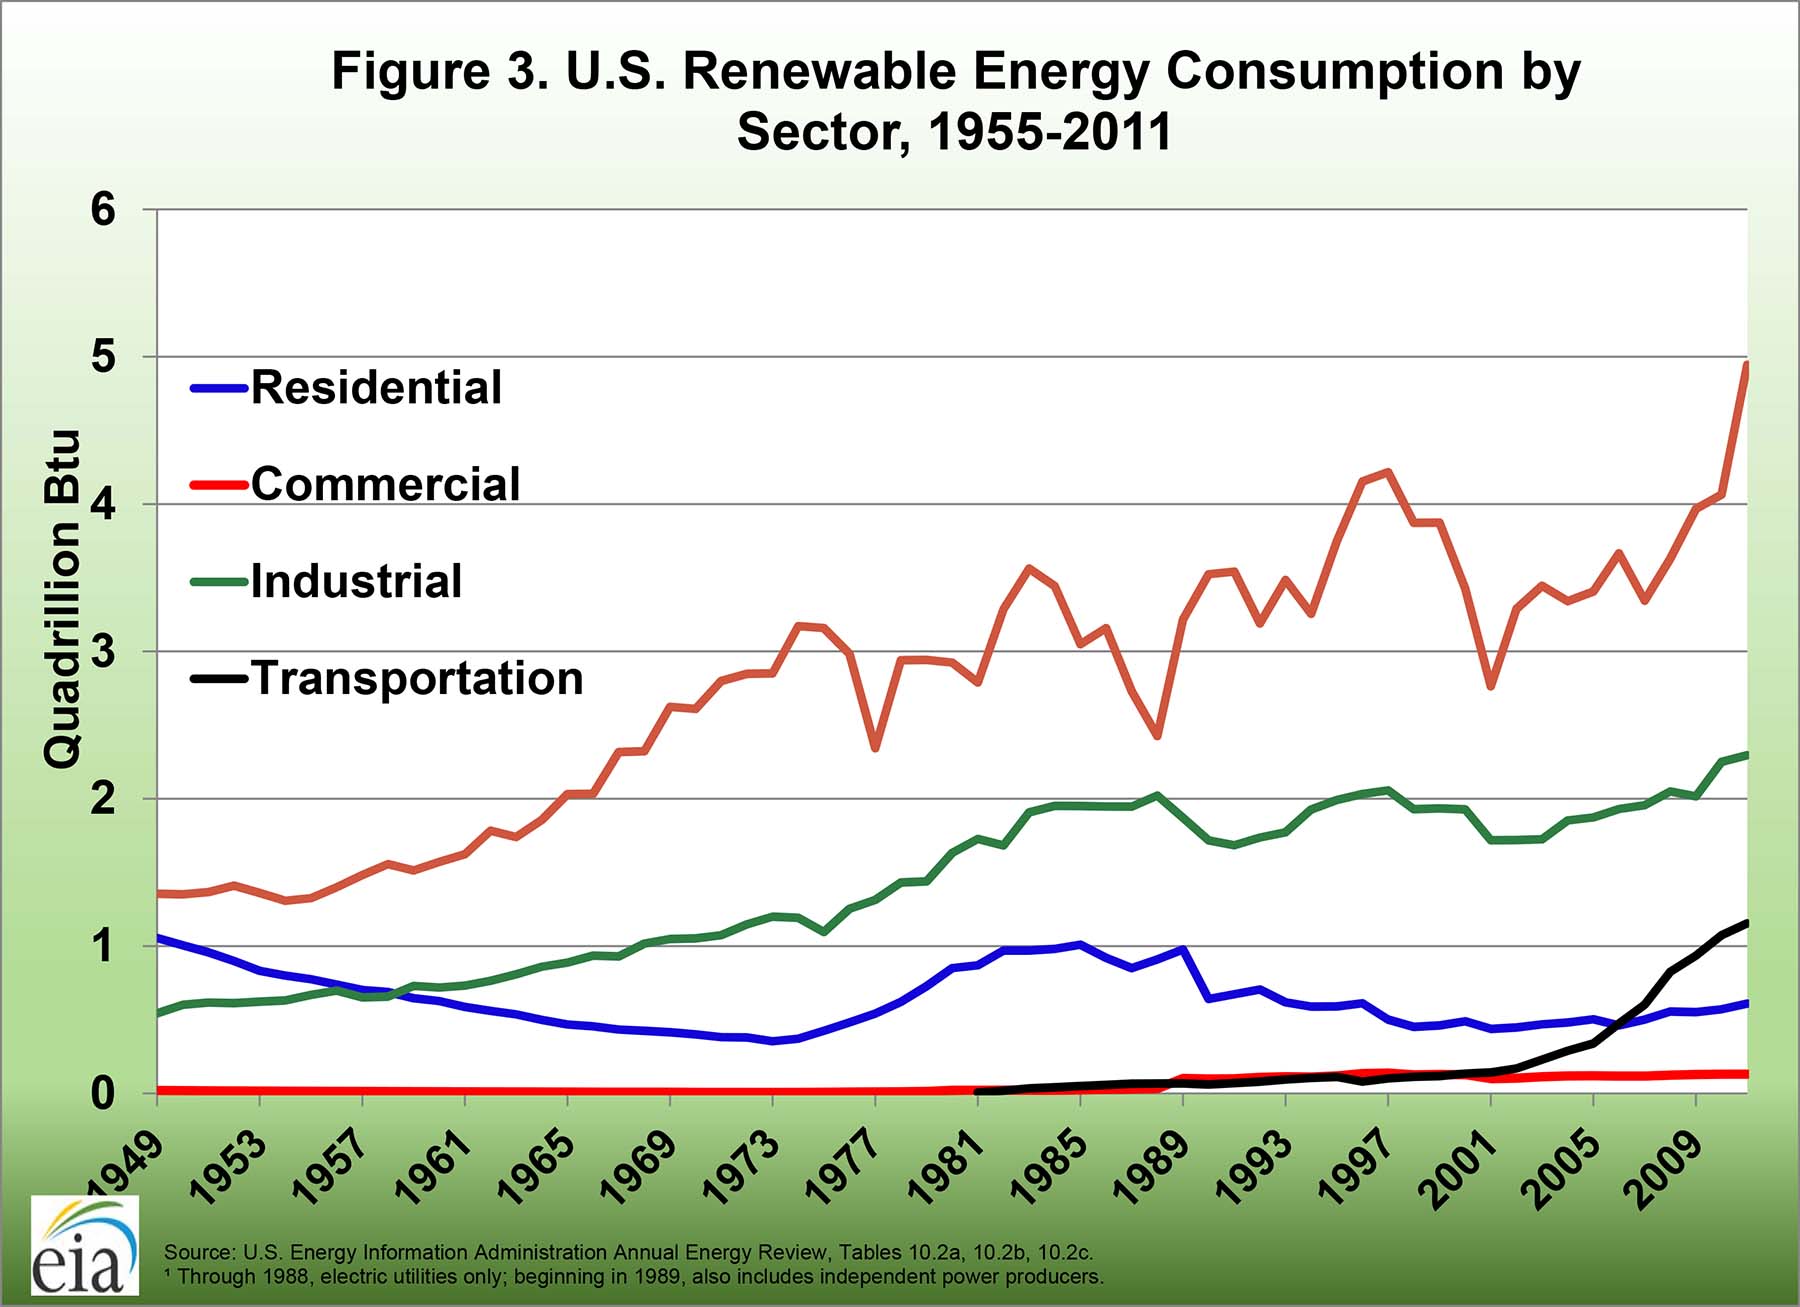
Renewable energy consumption by sector
Figure 3 shows renewable energy consumption by sector since 1949. The largest growth areas in use of renewable energy have been transportation and electric power generation. Industrial use of renewable energy also has trended slightly upward. In contrast, the chart indicates very little renewable energy has been used in the commercial sector and its use in the residential sector trended downward until the early 2000s. Since that time residential use has trended slightly upward.
Impact on greenhouse gases
Figure 4 shows the U.S. estimated carbon dioxide emissions by major sources since 1949. The year 2007 was an important turning point in which carbon dioxide emissions from coal and petroleum began to turn downward. Carbon emissions from petroleum were reduced by an estimated 12.5% from 2005 to 2011, along with a 13% reduction in those emissions from coal.

Reductions from these two energy sources were partially offset to a small extent by increased use of natural gas and a resulting increase in carbon dioxide emissions from that source.
Reductions in U.S. emissions of nitrogen oxides from energy consumption, as shown in Figure 5, have trended steadily downward since the late 1980s. From 1995 to 2011, emissions from this source were reduced by 69%, along with a 64% reduction in sulfur dioxide emissions (not shown in the chart) from 1993 to 2011. Nitrogen oxides emissions also trended slightly downward since 2002 in the industrial sector.

Concluding comments
U.S. government policies encouraging the production and use of renewable energy have had an important impact in two key sectors of the nation’s economy: (1) transportation and (2) electric power generation. Both areas have been significant emitters of carbon dioxide and other greenhouse gasses. Renewable energy has reduced carbon emissions modestly and has contributed to very sharp declines in emissions of sulfur oxides and nitrogen oxides.. Wind energy has been the primary driver of renewable energy changes in electric power generation, along with increased use of natural gas. Further progress in reducing greenhouse gas emissions is expected in this sector in the next several years through expanded use of wind and solar power
Because of the ethanol “Blend Wall” (saturated E-10 market) and increasing government fleet average automobile fuel mileage standards, further gains in the transportation sector will depend on (1) future government renewable fuel mandates, (2) cost-reducing technology for biofuels production, and (3) developing alternative power sources for cars and trucks, including electric vehicles, use of compressed natural gas and possible future use of fuel cells.
References
All charts in this report are from the U.S. Energy Information Administration.
1 Union of Concerned Scientists, Renewable Electricity Standards Deliver Economic Benefits, May 2013
2 Ibid.
3 Dar Denielson, “Iowa poised to move back up in wind power production ranking,” January 28, 2015
4 American Wind Energy Association, “U.S. Wind Energy State Facts”
5 Don Hofstrand, “Has Solar's Day in the Sun Finally Come?”, AgMRC Renewable Fuels Monthly Report
March 2015
